





Menu


This page may contain paid affiliate links. If you buy or register through them, MyFxBots may earn a commission or referral fee. See our disclaimer for details.


An AI‑driven grid EasyAI developed by EasyAlgos AI, designed for MetaTrader with M5 charts and multi‑currency support. The system combines machine learning forecasts, news and market filters, and flexible risk controls; live track records show sustained growth with controlled drawdown.
Trading Idea
A grid-based automated system that uses deep learning forecasts and market/news filters to open and manage multi-currency positions on M5 charts. It emphasizes capital protection, adjustable risk profiles, and automated pause around high‑impact events.
Specifications
Developer / Company
The EA is developed by EasyAlgos AI, registered in St. Vincent & The Grenadines.
Broker mentions
The product page references brokers including IC Markets as featured.
VPS
The developer offers an EasyVPS onboarding path and recommends using a VPS for optimal performance.
Support & contact
Support channels include email ([email protected]), Telegram, and a help center.
Live verification
Live track records are published on third‑party services (MyFxBook, FXBlue) and on the developer site.
MT5 Version
The expert advisor is compatible with MT5.
Supported Currency Pairs
NZDUSD, USDCAD, AUDNZD, AUDCAD, NZDCAD, and GBPCHF.
MetaTrader Chart Timeframe
M5 (5‑minute)

3rd Party-Verified EasyAI's Live Trading Result Statements
Live verified performance is published on third‑party trackers and the developer site, showing multi‑year growth and continuous monthly profits. Key public metrics include all‑time growth ~+338%, monthly gain ~1.8%, daily ~0.06%, and max drawdown ~21.96%.
Real Money Account

Live Test Summary
Started On
Aug 01, 2019
Account Leverage
1:300
Profit Factor
1.51
Total Gain
+338.23%
Absolute Gain
+277.05%
Monthly Gain
1.82%
Daily Gain
0.06%
Total Pips
-1,575.3
Total Trades
6,403
Profit Amount
$13,852.44
(%) Won Trades
-1,575.3
Drawdown
21.96%
Real Money Account
Started On
Aug 02, 2019
Leverage
1:500
Broker
Vantage Markets
Starting Balance
$5,000.00
Total Gain
333.97%
Live Test Summary
Started On
Aug 02, 2019
Account Leverage
1:500
Profit Factor
1.51
Total Gain
333.97%
Absolute Gain
333.97%
Monthly Gain
1.78%
Daily Gain
0.08%
Total Pips
-1,575.3
Total Trades
6403
Profit Amount
+13,852.44
(%) Won Trades
-1,575.3
Drawdown
The live track record indicates consistent positive months and a long history of trades (thousands of trades), suggesting robustness across market cycles; however, drawdown and average trade metrics warrant risk sizing and monitoring.
EasyAI's Backtests by MetaTrader Strategy Tester using High Quality Historical Tick Data
The developer provides back‑testing data alongside live stats to illustrate strategy behavior historically; backtests are presented as supporting evidence but include standard disclaimers about hypothetical limitations.
Trading With Significant Risk Settings.
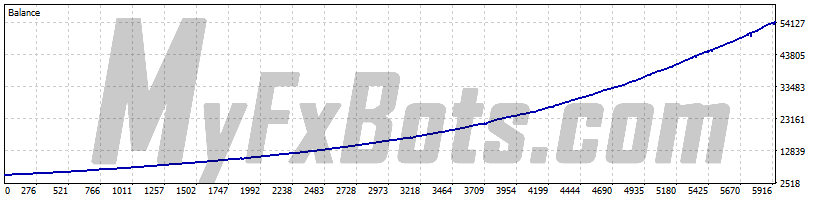
Backtests Settings
Symbol
AUDCAD
Period
M5 (2019.01.01 - 2025.06.25)
Broker
Currency
USD
Leverage
1:500
Symbols
5
Bars in test
483641
Ticks modelled
9531351
Modelling quality
100%
Initial Deposit
$5000.00
Backtests Results
Total net profit
49645.74
Gross profit
86040.05
Gross loss
-36394.31
Profit factor
2.36
Expected payoff
16.81
Margin level
1702.90%
Absolute Bal DD
0.19
Maximal Bal DD
1 198.38 (2.60%)
Relative Bal DD
3.11% (232.75)
Absolute EQ DD
73.77
Maximal EQ DD
3 564.35 (6.56%)
Relative EQ DD
18.67% (1 399.46)
Recovery Factor
13.93
Sharp Ratio
4.34
Z-Score
-2.18 (97.07%)
AHPR
1.0008 (0.08%)
LR Correlation
0.95
OnTester result
-
GHPR
1.0008 (0.08%)
LR Standard Error
4187.62
Total Trades
2954
Short positions
1160 (74.74%)
Long positions
1794 (73.91%)
Profit trades
2193 (74.24%)
Loss trades
761 (25.76%)
Largest Profit trade
1134.41
Largest Loss trade
-488.41
Average Profit trade
39.23
Average Loss trade
-44.10
Maximum consecutive wins (profit in money)
35 (1 300.73)
Maximum consecutive losses (loss in money)
4 (-1 024.55)
Maximal consecutive profit (count of wins)
1 676.65 (28)
Maximal consecutive loss (count of losses)
-1 169.70 (3)
Avarage consecutive wins
4
Avarage consecutive losses
1
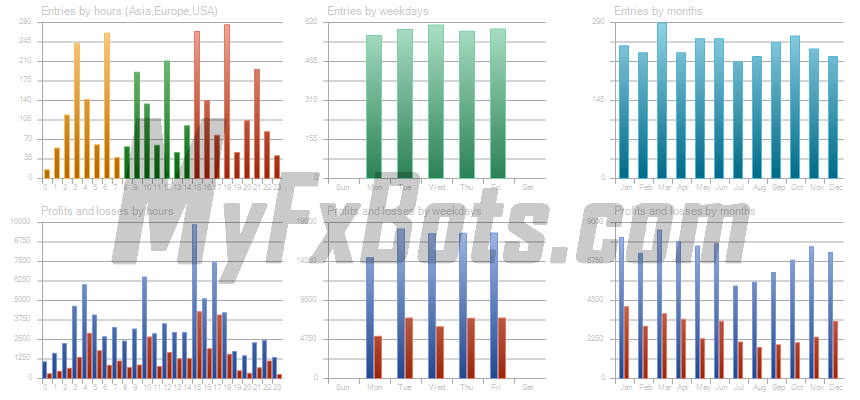
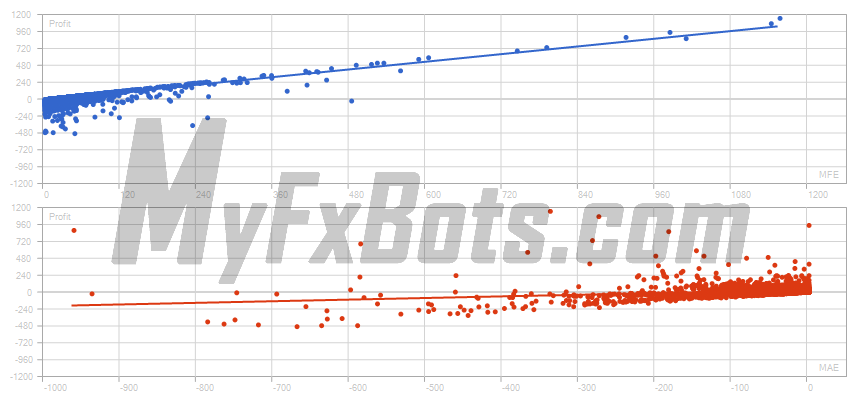
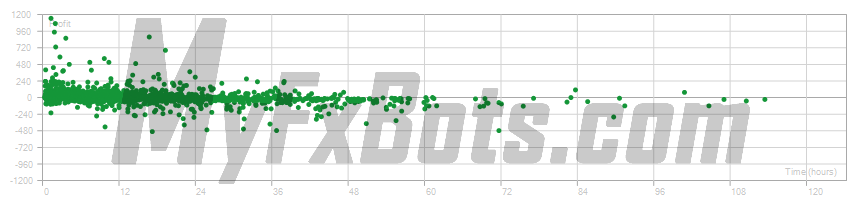
Trading With High Risk Settings.
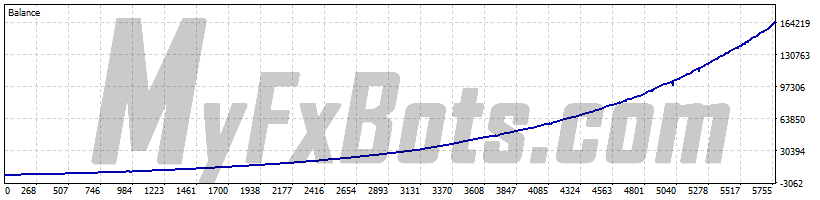
Backtests Settings
Symbol
AUDCAD
Period
M5 (2019.01.01 - 2025.06.25)
Broker
Currency
USD
Leverage
1:500
Symbols
5
Bars in test
483641
Ticks modelled
9531351
Modelling quality
100%
Initial Deposit
$5000.00
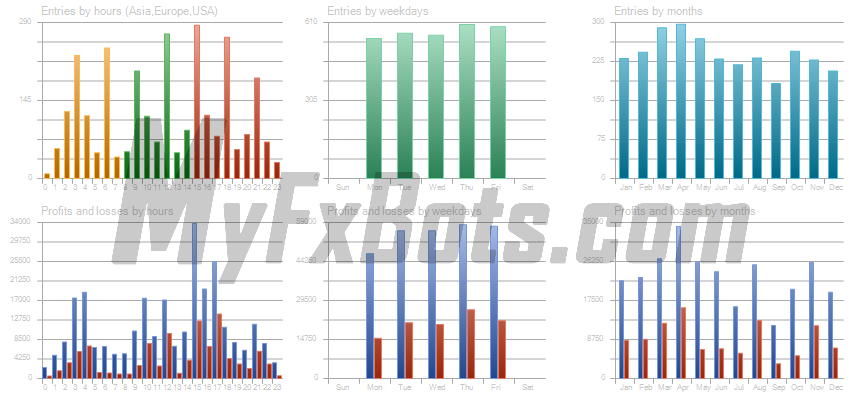
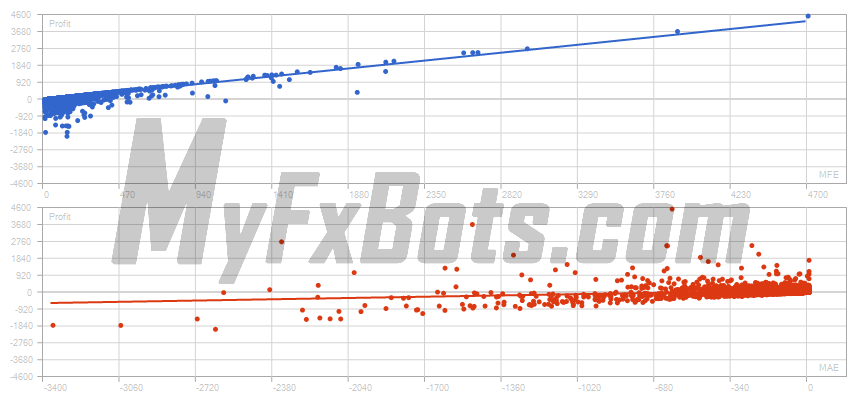
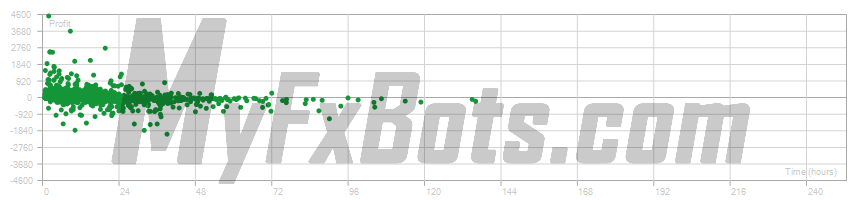
Backtests Results
Total net profit
160900.68
Gross profit
274837.37
Gross loss
-113936.69
Profit factor
2.41
Expected payoff
55.98
Margin level
965.74%
Absolute Bal DD
16.38
Maximal Bal DD
4 525.01 (4.38%)
Relative Bal DD
7.74% (1 103.51)
Absolute EQ DD
117.62
Maximal EQ DD
11 807.49 (11.43%)
Relative EQ DD
18.69% (1 612.60)
Recovery Factor
13.63
Sharp Ratio
3.91
Z-Score
-1.54 (87.64%)
AHPR
1.0012 (0.12%)
LR Correlation
0.92
OnTester result
-
GHPR
1.0012 (0.12%)
LR Standard Error
17091.57
Total Trades
2874
Short positions
1073 (74.46%)
Long positions
1801 (74.29%)
Profit trades
2137 (74.36%)
Loss trades
737 (25.64%)
Largest Profit trade
4495.80
Largest Loss trade
-2033.59
Average Profit trade
128.61
Average Loss trade
-142.28
Maximum consecutive wins (profit in money)
24 (755.00)
Maximum consecutive losses (loss in money)
5 (-1 092.73)
Maximal consecutive profit (count of wins)
6 364.34 (14)
Maximal consecutive loss (count of losses)
-4 469.13 (3)
Avarage consecutive wins
4
Avarage consecutive losses
1
Trading With Mild Risk Settings.
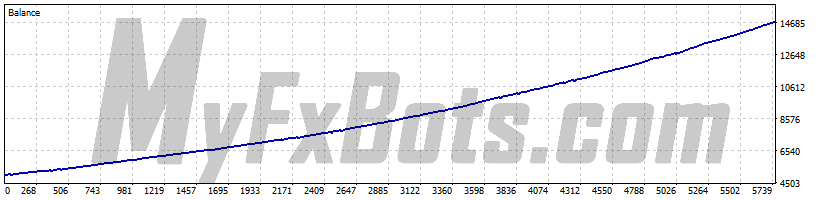
Backtests Settings
Symbol
AUDCAD
Period
M5 (2019.01.01 - 2025.06.25)
Broker
Currency
USD
Leverage
1:500
Symbols
5
Bars in test
483641
Ticks modelled
9531351
Modelling quality
100%
Initial Deposit
$5000.00
Backtests Results
Total net profit
9786.96
Gross profit
17195.52
Gross loss
-7408.56
Profit factor
2.32
Expected payoff
3.41
Margin level
1656.77%
Absolute Bal DD
6.91
Maximal Bal DD
226.56 (4.23%)
Relative Bal DD
4.23% (226.56)
Absolute EQ DD
270.50
Maximal EQ DD
620.35 (11.60%)
Relative EQ DD
11.60% (620.35)
Recovery Factor
15.78
Sharp Ratio
3.50
Z-Score
-4.21 (99.74%)
AHPR
1.0004 (0.04%)
LR Correlation
0.99
OnTester result
-
GHPR
1.0004 (0.04%)
LR Standard Error
431.19
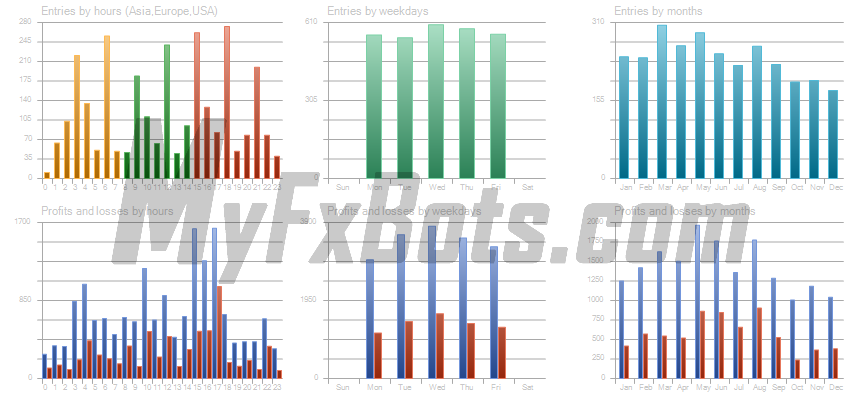
Total Trades
2866
Short positions
1143 (73.75%)
Long positions
1723 (74.41%)
Profit trades
2125 (74.15%)
Loss trades
741 (25.85%)
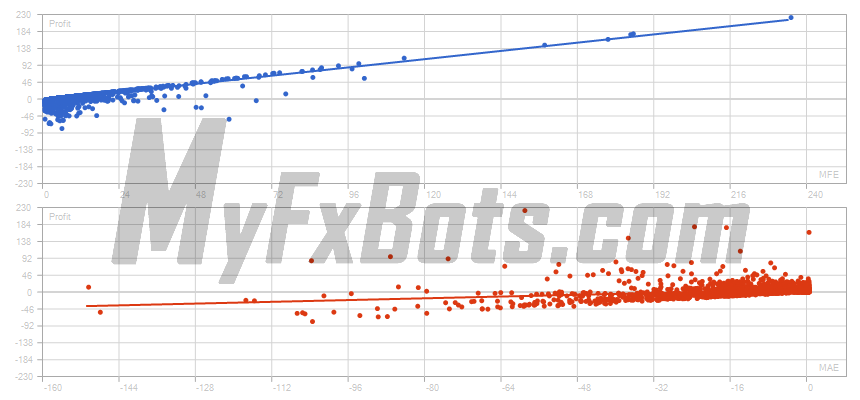
Largest Profit trade
220.75
Largest Loss trade
-80.07
Average Profit trade
8.09
Average Loss trade
-9.24
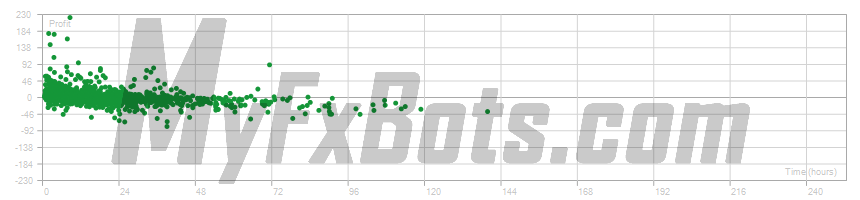
Maximum consecutive wins (profit in money)
24 (122.96)
Maximum consecutive losses (loss in money)
5 (-223.86)
Maximal consecutive profit (count of wins)
245.10 (7)
Maximal consecutive loss (count of losses)
-223.86 (5)
Avarage consecutive wins
4
Avarage consecutive losses
1
Trading With Low Risk Settings.
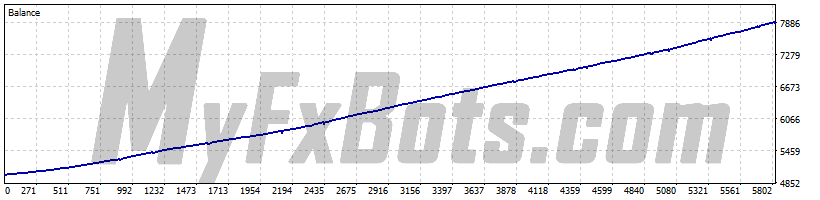
Backtests Settings
Symbol
AUDCAD
Period
M5 (2019.01.01 - 2025.06.25)
Broker
Currency
USD
Leverage
1:500
Symbols
5
Bars in test
483641
Ticks modelled
9531351
Modelling quality
100%
Initial Deposit
$5000.00
Backtests Results
Total net profit
2916.87
Gross profit
5142.92
Gross loss
-2226.05
Profit factor
2.31
Expected payoff
1.01
Margin level
8748.46%
Absolute Bal DD
2.18
Maximal Bal DD
49.34 (0.93%)
Relative Bal DD
0.93% (49.34)
Absolute EQ DD
17.71
Maximal EQ DD
157.28 (2.97%)
Relative EQ DD
2.97% (157.28)
Recovery Factor
18.55
Sharp Ratio
3.52
Z-Score
-4.03 (99.74%)
AHPR
1.0002 (0.02%)
LR Correlation
1.00
OnTester result
-
GHPR
1.0002 (0.02%)
LR Standard Error
49.97
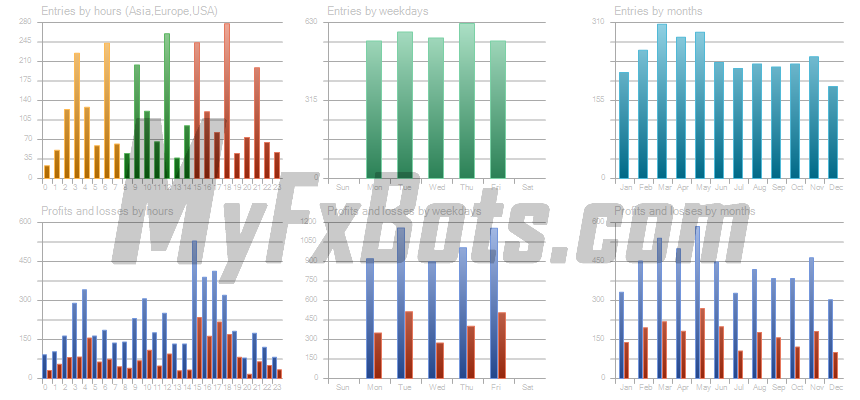
Total Trades
2898
Short positions
1059 (77.34%)
Long positions
1839 (72.27%)
Profit trades
2148 (74.12%)
Loss trades
750 (25.88%)
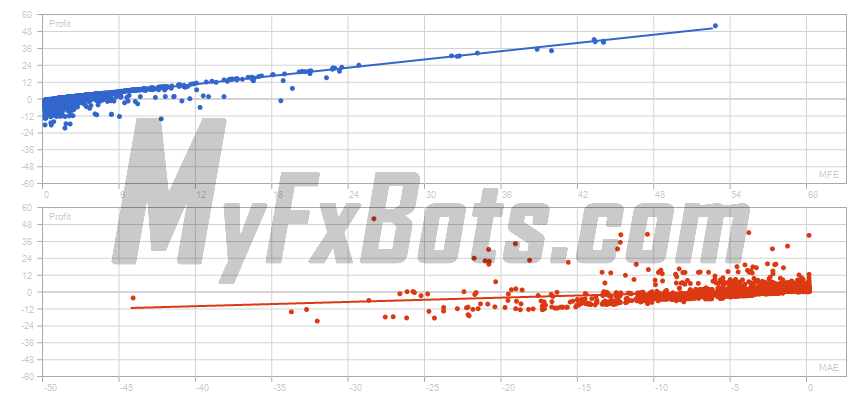
Largest Profit trade
52.04
Largest Loss trade
-20.23
Average Profit trade
2.39
Average Loss trade
-2.73
Maximum consecutive wins (profit in money)
18 (32.11)
Maximum consecutive losses (loss in money)
5 (-38.63)
Maximal consecutive profit (count of wins)
53.55 (2)
Maximal consecutive loss (count of losses)
-48.90 (4)
Avarage consecutive wins
4
Avarage consecutive losses
1
Trading With 0.01 Lots per 500.
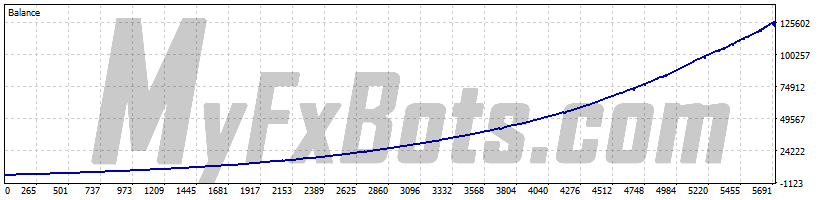
Backtests Settings
Symbol
AUDCAD
Period
M5 (2019.01.01 - 2025.06.25)
Broker
Currency
USD
Leverage
1:500
Symbols
5
Bars in test
483641
Ticks modelled
9531351
Modelling quality
100%
Initial Deposit
$5000.00
Backtests Results
Total net profit
121876.06
Gross profit
223206.18
Gross loss
-101330.12
Profit factor
2.20
Expected payoff
42.88
Margin level
774.69%
Absolute Bal DD
27.88
Maximal Bal DD
3 773.60 (2.98%)
Relative Bal DD
7.71% (999.10)
Absolute EQ DD
213.49
Maximal EQ DD
8 869.09 (7.05%)
Relative EQ DD
16.86% (2 173.99)
Recovery Factor
13.74
Sharp Ratio
3.44
Z-Score
-3.76 (99.74%)
AHPR
1.0011 (0.11%)
LR Correlation
0.93
OnTester result
-
GHPR
1.0011 (0.11%)
LR Standard Error
12204.40
Total Trades
2842
Short positions
1043 (75.65%)
Long positions
1799 (72.54%)
Profit trades
2094 (73.68%)
Loss trades
748 (26.32%)
Largest Profit trade
4008.24
Largest Loss trade
-1518.92
Average Profit trade
106.59
Average Loss trade
-125.65
Maximum consecutive wins (profit in money)
26 (620.88)
Maximum consecutive losses (loss in money)
5 (-999.10)
Maximal consecutive profit (count of wins)
4 008.24 (1)
Maximal consecutive loss (count of losses)
-3 690.44 (4)
Avarage consecutive wins
4
Avarage consecutive losses
1
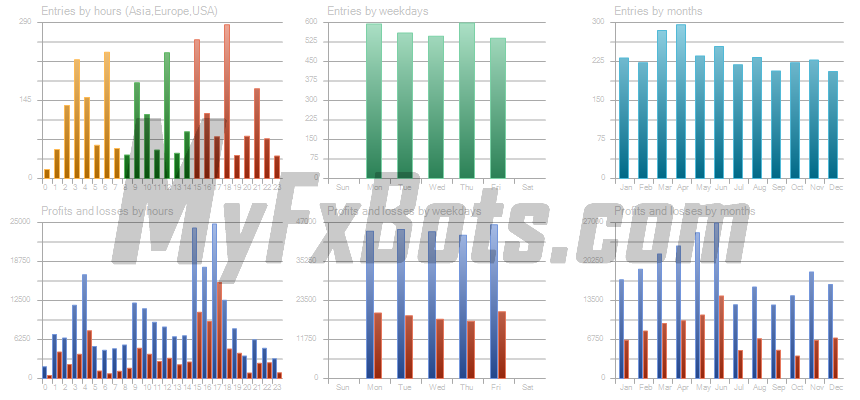
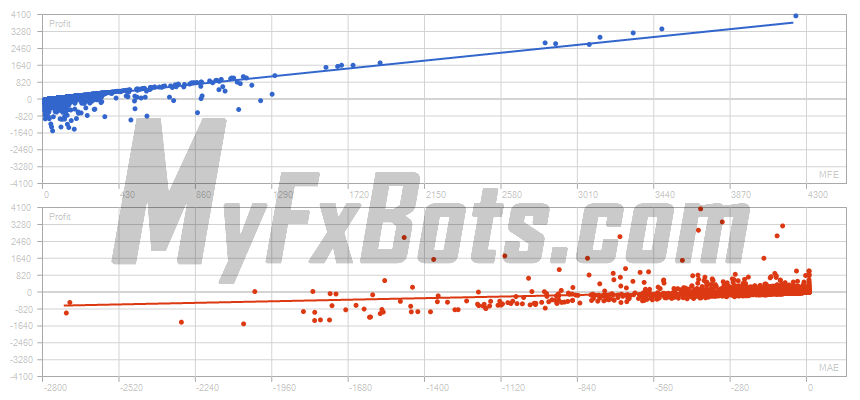
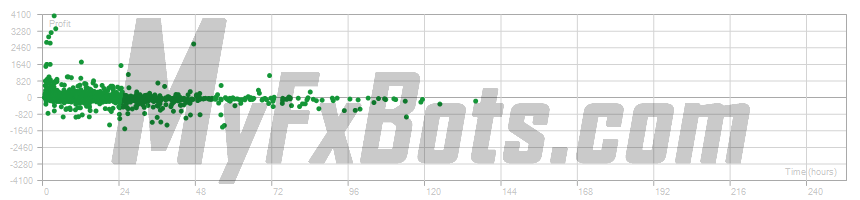
Backtests support the live performance narrative but should be treated as illustrative; traders must account for slippage, liquidity, and execution differences when moving to real accounts.
EasyAI's Trading Strategy
- Grid trading (grid system): The core approach opens laddered buy/sell orders to capture mean reversion and trend continuation opportunities on M5 charts; risk is managed via configurable grid spacing and lot sizing.
- AI market forecasts: Machine learning models analyze historical and live data to bias entries and exits; forecasts are used alongside rule‑based filters.
- News filter (News Trading (in Bing)): Automatic pause before/after high‑impact events to reduce slippage and volatility exposure.
- Market filters: Additional conditions that suspend trading under adverse market regimes.
- Flexible risk profiles: User-selectable risk levels (Low to High) that adjust position sizing and drawdown thresholds.
- Capital protection: Built‑in maximum drawdown and stop‑loss settings to safeguard equity.
- Multi‑currency execution: Simultaneous trading across supported pairs to diversify signal sources.
EasyAI's MetaTrader Parameters
- Risk level: Selectable from Low to High — adjusts lot sizing and exposure.
- Grid spacing and lot sizing: Controls distance between orders and incremental lot multipliers.
- Maximum drawdown / capital protection: Set absolute drawdown limits and stop‑loss thresholds.
- News filter toggle: Enable/disable automatic pause around high‑impact events.
- Market filters: Conditions to suspend trading in volatile or illiquid regimes.
- Supported pairs selection: Choose which of the supported currency pairs to trade.
EasyAI's Review Bottom Line
EasyAI is a professionally presented AI grid EasyAI with multi‑year live verification, flexible risk controls, and practical safeguards (news/market filters). It suits traders seeking automated grid exposure on M5 across several pairs, but prudent risk sizing and monitoring are essential given observed drawdowns.
Other Forex Robots from EasyAlgos AI
A grid-based automated system that uses deep learning forecasts and market/news filters to open and manage multi-currency positions on M5 charts. It emphasizes capital protection, adjustable risk profiles, and automated pause around high‑impact events.

EasyWaka implements a dynamic grid system that exploits short‑term inefficiencies and trend swings on M15. It uses adaptive grid sizing, news and market filters, and configurable risk levels to hold positions across moves for long‑term growth. Mentions of News Trading and Trend Trading are part of the strategy mix.

The system implements a grid trading approach that uses machine learning to detect reversal points and optimize execution. It opens multiple levels on XAUUSD and manages exposure via adjustable risk levels, stop-loss caps and automatic pauses around high-impact events using a built-in news filter.

EasyMomentum applies AI and neural networks to detect early momentum and breakout conditions on M1 charts, entering directional trades across multiple FX pairs while pausing around high‑impact events via a news filter. The approach blends momentum and breakout concepts with strict risk controls.
Tags
Valery Trading
Tickmill
Algocrat AI
FXAutomater
WallStreet Forex Robot 3.0 Domination
Tick Data Suite
IC Markets
StrategyQuant X
Waka Waka
Perceptrader AI
Forex Diamond
Volatility Factor Pro
RoboForex
XM
HF Markets
InstaForex
Alpari
FX Scalper X
Forex Combo System
GPS Forex Robot
Golden Pickaxe
Forex Trend Detector
GrandCapital
Automated Forex Tools
Omega Trend
Broker Arbitrage
TradingFX VPS
AMarkets
Telegram Signal Copier
SMRT Algo
EasyAlgos AI
Quant Analyzer
AlgoCloud
Forex Trend Hunter
FXVM
Forex Gold Investor
Binance
Infinity Trader
Gold Miner
Sentinel AI
RayBOT
Gold Scalper PRO
LeapFX Trading Academy
ForexSignals.com
FxPro
ACY Securities
Zone Hunter Robot
Elirox
FX-Builder
Quant Data Manager
Commercial Network Services
FXCharger
News Scope EA PRO
Happy Forex
FXTM
BlackBull
Libertex
Smart Scalper PRO
Happy Bitcoin
Pump Trader Robot
WallStreet Recovery PRO
SlingShot
Dark Kronos
Vortex Trader PRO
Swing Trader PRO
Pepperstone
VPS Forex Trader
QHoster
FX Secret Club
Best Free Scalper Pro
Magnetic Exchange
Exness
StarTrader
Forex VPS
MTeletool
Trend Matrix EA
Telegram Copier
Forex Robot Academy
Forex Robot Factory (Expert Advisor Generator)
ByBit
Database Mart
Gold Breaker
DARKEAS
Quant Tekel Funded
XAUBOT
ChartPrime
easyVPS
EGPForex
Risk
Forex trading can involve the risk of loss beyond your initial deposit. It is not suitable for all investors and you should make sure you understand the risks involved, seeking independent advice if necessary.
Forex accounts typically offer various degrees of leverage and their elevated profit potential is counterbalanced by an equally high level of risk. You should never risk more than you are prepared to lose and you should carefully take into consideration your trading experience.
Past performance and simulated results are not necessarily indicative of future performance. All the content on this site represents the sole opinion of the author and does not constitute an express recommendation to purchase any of the products described in its pages.
Sponsored By




Get Funded







Search Queries Cloud
BTC
in control
best free forex robot
أفضل إكسبرت
fx fx scalper
Fx scalper
waka waka
Fx stabilizer
原騰國際
UABTIC
fx scalper x
wallstreet forex
ProFX
forex diamond
pfx scalper
waka
Forex vps
switchback
algo pro
recovery
discount
cross pro
porsaj
waka waka news filter is disabled
futuretrading
Trailing stop
RENKO EA AUTO TRADER
trade copier
Copy trade
future indikatoren
happy gold
wall street
ARBITRAGE
data
Evening Scalper Pro
Forex inControl 3.0 Review
alpha striker
vision scalper
Me ta trader 5
Download Trailing Stop Forex Robot