













Executive summary
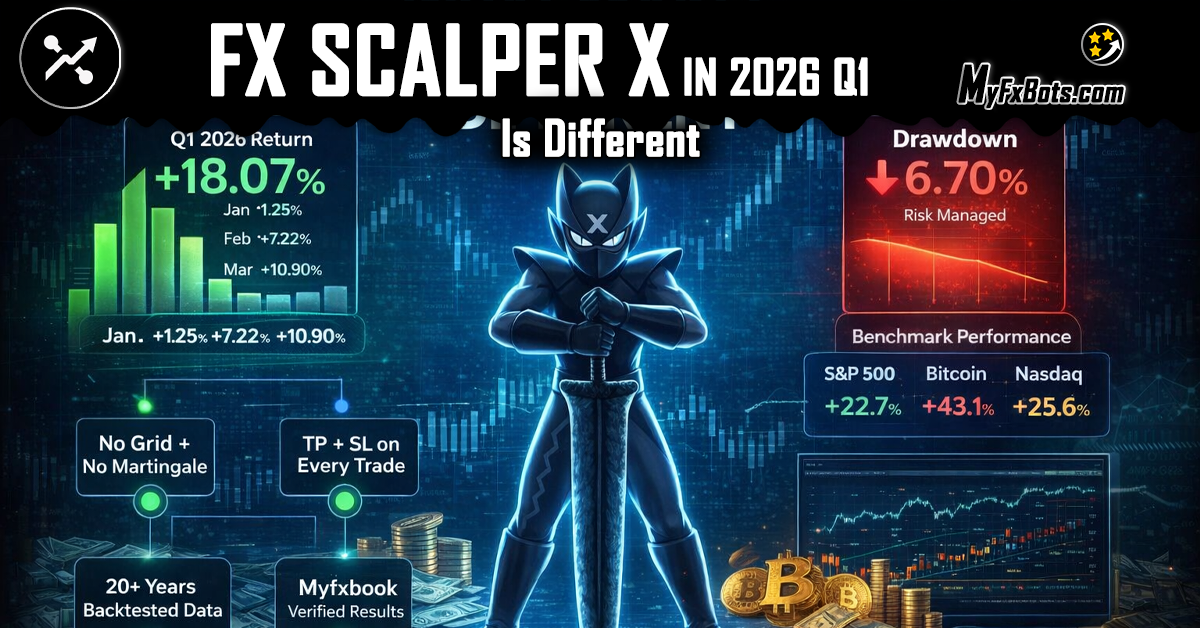
- Q1 2026 result: +18.07% total return.
- Monthly breakdown: January +1.25%, February +7.22%, March +10.90%.
- Quarterly drawdown: 6.70%.
- Context: The EA outperformed major benchmarks (S&P 500, Nasdaq, Bitcoin, Gold) during a mixed market quarter.
What the numbers tell us
- Return vs. drawdown profile A +18.07% quarterly return with a 6.70% drawdown implies a favorable risk‑adjusted outcome for a short period: the return/drawdown ratio is roughly 2.7:1 for the quarter, which is attractive for many systematic traders. The monthly ramp—small January, then accelerating—suggests the system capitalized on improving market conditions through February–March.
- Consistency and compounding potential The steady monthly gains (1.25%, 7.22%, 10.90%) indicate the EA can compound returns when allowed to run uninterrupted. However, one quarter is a short sample; longer-term stability should be validated across multiple market regimes.
- Benchmark outperformance The developer’s summary highlights outperformance versus S&P 500, Nasdaq, Dow, Russell 2000, Gold, Silver and Bitcoin for Q1 — in percentage‑point terms the EA beat the S&P 500 by ~22.7 points and Bitcoin by ~43 points. That relative strength is notable in a quarter where many benchmarks were flat or negative.
Risk metrics and trade behavior
- Drawdown control: A 6.70% quarterly drawdown is moderate; it suggests the EA uses position sizing and stop logic that limit large equity swings in this period.
- Win rate and expectancy: While the Myfxbook page contains fuller trade statistics (total trades, average win/loss, profit factor), the Q1 snapshot implies the system achieved positive expectancy and consistent edge across many small-to-medium trades.
- Market exposure: The EA’s trades (currency pairs and cross‑pairs) and average trade durations indicate a scalping / short‑term bias with occasional multi‑day positions; this hybrid behavior can smooth returns but requires robust execution and low latency.
Strengths observed
- Outperformance in a tough quarter: Beating major indices and commodities in Q1 is a strong marketing and performance signal.
- Low-to-moderate drawdown: The 6.70% figure supports the claim of controlled risk for the quarter.
- Clear monthly progression: The acceleration from January to March suggests the strategy adapts or benefits from certain volatility regimes.
Caveats and what to watch
- Sample length: One quarter is insufficient to conclude long-term robustness. Verify performance across multiple years and different market cycles.
- Leverage and account specifics: Live results depend on broker execution, spreads, commissions, and leverage. The developer’s Myfxbook account shows specific leverage and account history that prospective users should review.
- Drawdown history: Check historical maximum drawdown and recovery periods on the full Myfxbook record before sizing capital.
Practical takeaways for traders
- Due diligence: Review the full Myfxbook history, trade list, and equity curve; confirm broker conditions (execution, slippage).
- Start small and scale: Consider a phased allocation: pilot capital, monitor live slippage and real‑world fills, then scale if results match backtest/live claims.
- Use proper risk management: Cap per‑trade risk and set portfolio-level drawdown limits.
Final verdict (concise)
Q1 2026 was a strong quarter for the EA as reported on Myfxbook: +18.07% with 6.70% drawdown, outperforming major benchmarks in a mixed market. The numbers are promising, but prudent investors should validate longer-term stability, execution conditions, and historical drawdown behavior before committing significant capital.
Note on partnerships and broker context
The developer notes promotional and broker relationships; where broker offers or deposit bonuses are discussed, the developer has consent to summarize such offers publicly — and readers may register via the developer’s referral link with IC if they choose.