Menu
Featured Solutions
Forex Brokers
Forex VPS Services
Forex Service Providers
Currency Exchange Companies
Payment Processors
MyFxBots Forex Blog
2025 Posts
Sep, 2025 Posts
Aug, 2025 Posts
Jul, 2025 Posts
Jun, 2025 Posts
May, 2025 Posts
Apr, 2025 Posts
Mar, 2025 Posts
2024 Posts
Dec, 2024 Posts
Nov, 2024 Posts
Oct, 2024 Posts
Jun, 2024 Posts
Apr, 2024 Posts
Mar, 2024 Posts
Feb, 2024 Posts
Jan, 2024 Posts
2023 Posts
Dec, 2023 Posts
Nov, 2023 Posts
Oct, 2023 Posts
Sep, 2023 Posts
Aug, 2023 Posts
Jul, 2023 Posts
Jun, 2023 Posts
May, 2023 Posts
Apr, 2023 Posts
Mar, 2023 Posts
Feb, 2023 Posts
Jan, 2023 Posts
2022 Posts
Dec, 2022 Posts
Nov, 2022 Posts
Oct, 2022 Posts
Sep, 2022 Posts
Aug, 2022 Posts
Jul, 2022 Posts
Jun, 2022 Posts
May, 2022 Posts
Apr, 2022 Posts
Mar, 2022 Posts
Feb, 2022 Posts
Jan, 2022 Posts
2021 Posts
Dec, 2021 Posts
Oct, 2021 Posts
Sep, 2021 Posts
Aug, 2021 Posts
Jul, 2021 Posts
Jun, 2021 Posts
May, 2021 Posts
Apr, 2021 Posts
Mar, 2021 Posts
Feb, 2021 Posts
Jan, 2021 Posts
2020 Posts
Dec, 2020 Posts
Nov, 2020 Posts
Oct, 2020 Posts
Sep, 2020 Posts
Aug, 2020 Posts
Jul, 2020 Posts
2019 Posts
Dec, 2019 Posts
Nov, 2019 Posts
Jul, 2019 Posts
Jun, 2019 Posts
May, 2019 Posts
Apr, 2019 Posts
2018 Posts
Dec, 2018 Posts
Nov, 2018 Posts
Jun, 2018 Posts
Apr, 2018 Posts
Mar, 2018 Posts
Feb, 2018 Posts
Jan, 2018 Posts
2017 Posts
Dec, 2017 Posts
Nov, 2017 Posts
Sep, 2017 Posts
Aug, 2017 Posts
May, 2017 Posts
Apr, 2017 Posts
Mar, 2017 Posts
Jan, 2017 Posts
2016 Posts
Dec, 2016 Posts
Nov, 2016 Posts
Oct, 2016 Posts
Sep, 2016 Posts
Aug, 2016 Posts
Jun, 2016 Posts
May, 2016 Posts
Apr, 2016 Posts
Mar, 2016 Posts
2015 Posts
Nov, 2015 Posts
Oct, 2015 Posts
Jun, 2015 Posts
May, 2015 Posts
Apr, 2015 Posts
Mar, 2015 Posts
Feb, 2015 Posts
2014 Posts
Dec, 2014 Posts
Nov, 2014 Posts
Oct, 2014 Posts
Sep, 2014 Posts
Aug, 2014 Posts
Jul, 2014 Posts
Jun, 2014 Posts
May, 2014 Posts
Apr, 2014 Posts
Mar, 2014 Posts
Feb, 2014 Posts
Jan, 2014 Posts
2013 Posts
Dec, 2013 Posts
Nov, 2013 Posts
Oct, 2013 Posts
Jul, 2013 Posts
Apr, 2013 Posts
Mar, 2013 Posts
Search Queries Cloud
Sign In / Sign Up
MyFxBots
Welcome
Visitor
Sign In / Sign Up
Forex Diamond EA v6.6: Enhanced Time Management for Forex Trading
Hybrid Intelligence in Forex: Merging AI with Rule-Based EAs
Unlocking Genuine AI Power in Forex Automated Trading
Open-Source Forex EAs: Dark Venus–Titan Custom Source Codes
Building & Testing Cutting-Edge Forex EAs
Perceptrader AI Review: 2% Monthly Returns with Automated Trading
Valery Trading Releases Major EA 2025 Updates: Waka Waka, Perceptrader AI & More
From Blow‐Ups to 35% Returns in 12 Months with Algorithmic Forex EAs
Forex Diamond EA v6.5 Released – Optimized Trading & Prop Firm Ready
Has Algocrat AI Lost Its Edge? A Detailed Performance Review
Momentum Trading Mastery: Unveiling the Strategy Behind Top Hedge Funds
Unlocking Gold’s Potential: Achieving 4,265% Profit with Automated Trading
Innovative Crypto Portfolio Revamp Elevates Trading Performance
MT5 Support Ends: A Critical Review of ByBit, Valery Trading and Algocrat AI
Unlocking Free EasyAlgos AI Trading: A New Era for Expert Advisors
Revolutionary Forex Trading Success: EasyAlgos AI Expert Advisors Showcase Exceptional MyFxBook Performance
The Hidden Flaw in Trading: Why Disciplined Systems Matter
March 2025: Resilient Crypto Copy Trading Performance in a Volatile Market
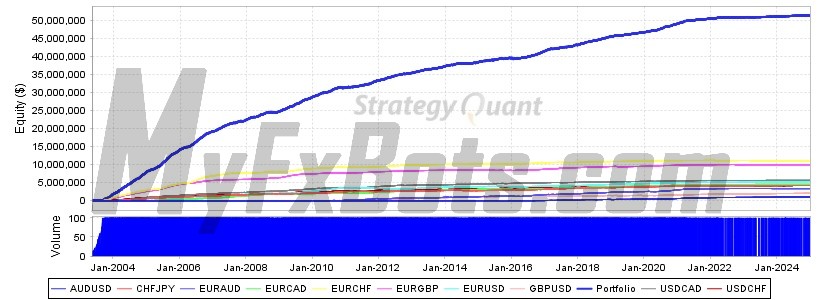
Quant Analyzer Portfolio Report
Portfolio
Total Profit
$ 51431071.07
Profit in pips
60135 pips
Yrly Avg profit
$ 2373794.22
Yrly Avg % ret
2373.79 %
CAGR
31.19 %
# of trades
18093
Sharpe ratio
0.15
Profit factor
3.31
Return / DD ratio
131.19
Winning %
97.64 %
Drawdown
$ 392023.53
% Drawdown
9.91 %
Daily Avg profit
$ 11401.26
Mthly Avg profit
$ 197811.81
Average trade
$ 5301.22
Annual% / Max DD%
3.15
R Expectancy
0.05 R
R Exp score
45.57 R
SQN
40.59
SQN score
46.36
Strategies in portfolio
| # | Name | Symbol | Timeframe | Net Profit ($) | Net Profit (pips) | # of Trades | Sharpe Ratio | Profit Factor |
| S2 | AUDUSD | AUDUSD | unknown | $ 1032550.8 | 1440 pips | 613 | 0.3 | 3.63 |
| S3 | CHFJPY | CHFJPY | unknown | $ 4204091.47 | 4465 pips | 1587 | 0.23 | 2.22 |
| S4 | EURAUD | EURAUD | unknown | $ 3354717.91 | 4359 pips | 994 | 0.18 | 2.49 |
| S5 | EURCAD | EURCAD | unknown | $ 4527419.96 | 5348 pips | 1283 | 0.18 | 3.36 |
| S6 | EURCHF | EURCHF | unknown | $ 11099124.41 | 11611 pips | 2789 | 0.27 | 8.62 |
| S7 | EURGBP | EURGBP | unknown | $ 9973877.03 | 7325 pips | 2342 | 0.27 | 6.45 |
| S8 | EURUSD | EURUSD | unknown | $ 5283561.02 | 7714 pips | 3127 | 0.08 | 2.16 |
| S9 | GBPUSD | GBPUSD | unknown | $ 2070645.7 | 2756 pips | 1266 | 0.15 | 1.93 |
| S10 | USDCAD | USDCAD | unknown | $ 5646567.88 | 8675 pips | 2084 | 0.23 | 4.47 |
| S11 | USDCHF | USDCHF | unknown | $ 4238514.89 | 6442 pips | 2008 | 0.19 | 2.68 |
| # | Name | Return / DD Ratio | Winning % | Drawdown | % Drawdown | Yearly avg. profit | Monthly avg. profit | Daily avg. profit |
| S2 | AUDUSD | 10.3 | 98.69 % | $ 100240 | 36.21 % | $ 127746.58 | $ 10644.85 | $ 1706.7 |
| S3 | CHFJPY | 24.52 | 96.41 % | $ 171477.95 | 41.93 % | $ 231423.71 | $ 19284.82 | $ 2230.29 |
| S4 | EURAUD | 15.11 | 95.88 % | $ 221947.76 | 60.25 % | $ 273777.38 | $ 22821.21 | $ 3314.94 |
| S5 | EURCAD | 18.11 | 97.12 % | $ 250033.29 | 52.53 % | $ 267622.39 | $ 22302.56 | $ 2815.56 |
| S6 | EURCHF | 84.32 | 99.07 % | $ 131634.72 | 1.65 % | $ 605537.03 | $ 50450.57 | $ 5250.3 |
| S7 | EURGBP | 47.85 | 99.06 % | $ 208424.8 | 5.52 % | $ 515643.48 | $ 42990.85 | $ 5308.08 |
| S8 | EURUSD | 13.38 | 96.8 % | $ 394870 | 90.03 % | $ 243919.05 | $ 20321.39 | $ 1857.79 |
| S9 | GBPUSD | 10.5 | 96.37 % | $ 197150 | 59.08 % | $ 148772.46 | $ 12399.08 | $ 1633 |
| S10 | USDCAD | 42.33 | 98.22 % | $ 133396.99 | 38.28 % | $ 276692.66 | $ 23047.22 | $ 2306.6 |
| S11 | USDCHF | 16.63 | 97.36 % | $ 254937.26 | 33.74 % | $ 205931.03 | $ 17159.98 | $ 1942.49 |
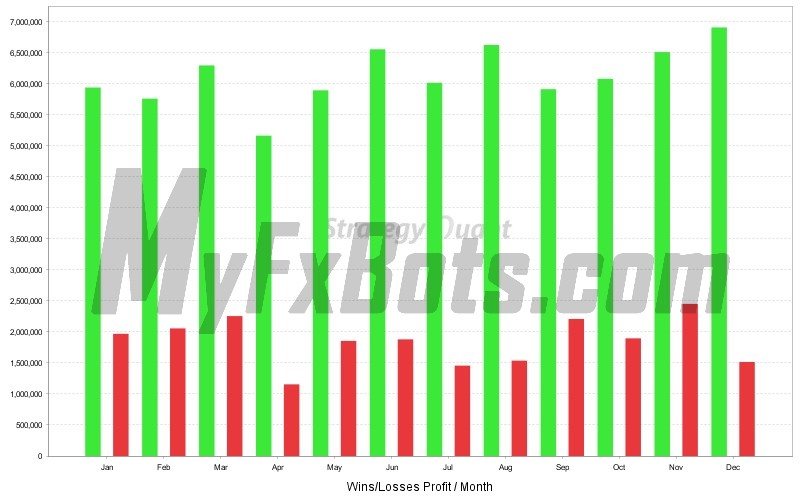
Monthly Performance ($)
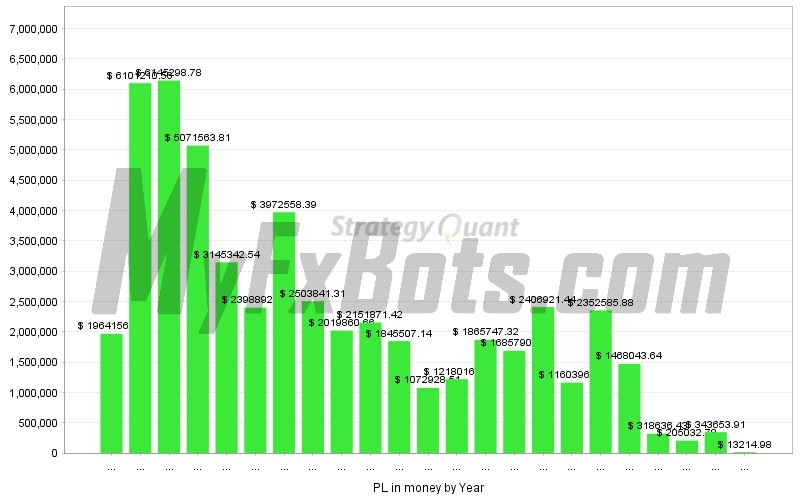
| Year | Jan | Feb | Mar | Apr | May | Jun | Jul | Aug | Sep | Oct | Nov | Dec | YTD |
| 2025 | 13214.98 | 0 | 0 | 0 | 0 | 0 | 0 | 0 | 0 | 0 | 0 | 0 | 13214.98 |
| 2024 | -5679.24 | 19840.25 | 28919.57 | 83450.15 | 24172.57 | 28379.11 | 35414.41 | 26563.49 | 22642.8 | 17106.61 | 27428.11 | 35416.08 | 343653.91 |
| 2023 | 43090.02 | -10896.73 | -87830.94 | 26991.31 | 71166.1 | 6500 | 29419.48 | 18594.7 | 11046.35 | 45850.6 | 15457.8 | 35644.09 | 205032.78 |
| 2022 | 37737.19 | -9160.59 | 173841.66 | 9020 | 23100 | -25733.39 | 47048.08 | 46571.54 | -63835.79 | 47765.6 | 3221.88 | 29060.25 | 318636.43 |
| 2021 | 239948.48 | 146354.6 | 358230 | 98434.57 | 52297.51 | 45351.56 | 152258.03 | 65185.68 | 44581.52 | 43580.9 | 108731.27 | 113089.52 | 1468043.64 |
| 2020 | 132646.62 | 148863.85 | 243539.28 | -147560.77 | 291428.71 | 254281.87 | 293524.25 | 296212.31 | 80885.96 | 181937.01 | 321013.97 | 255812.82 | 2352585.88 |
| 2019 | 91065.36 | 211605.47 | -122040.81 | 87756.44 | 166514.66 | 40525.76 | 103818.26 | 139885.15 | 106682.85 | 123568.43 | 157960.51 | 53054.39 | 1160396.47 |
| 2018 | 314934.02 | 101104.73 | 321625.11 | 175418.56 | 159198.97 | 178278.72 | 100331.99 | 234048.18 | 174237.62 | 158215.67 | 276257.42 | 213270.45 | 2406921.44 |
| 2017 | 351283.52 | 214547.88 | 75283.21 | 68323.99 | 3413.92 | 236532.9 | 135672.43 | 30590.67 | 163539 | 90887.65 | 353272.92 | -37558.08 | 1685790.01 |
| 2016 | -253461.13 | 77121.42 | 74190.7 | 204248.78 | 6920.91 | 275741.78 | 79001.09 | 294124.6 | 180861.2 | 284464.52 | 348468.63 | 294064.82 | 1865747.32 |
| 2015 | 224988.64 | 147023.11 | 38660.69 | 201688.02 | 49545.98 | -41877.8 | 216274.91 | 284741.04 | -188881.87 | 98577.66 | 116264.03 | 71011.73 | 1218016.14 |
| 2014 | 197899.13 | 113161.79 | 41929.72 | 260593.13 | 105782.32 | 36134.53 | 3408.15 | -17792.85 | -98420.11 | 177010.09 | 19769.87 | 233452.74 | 1072928.51 |
| 2013 | 174815.84 | 207288.94 | 123732.54 | 183117.94 | 226388.74 | 117605.63 | -11998.95 | 171451.67 | 23999.64 | 179344.23 | 157002.66 | 292758.26 | 1845507.14 |
| 2012 | 271912.83 | 93186.73 | 338674.4 | 201669.29 | 211877.18 | 220701.15 | 206761.27 | 191900.16 | 130872.22 | 30983.4 | 81217.25 | 172115.54 | 2151871.42 |
| 2011 | 208610.39 | -4238.41 | 88912.52 | 46192.86 | 144727.02 | 273523.62 | 71060.75 | 210558.75 | 174038.16 | 371170.9 | 301481.61 | 133822.49 | 2019860.66 |
| 2010 | 262718.88 | 198858.35 | 447724.28 | 197143.23 | 104968.07 | 276430.13 | 325864.7 | 338674.9 | 285160.57 | 194236.25 | -201026.14 | 73088.09 | 2503841.31 |
| 2009 | 243054.39 | 332683.28 | 352612.85 | 398798.62 | 141437.21 | 517671.08 | 194322.22 | 467401.77 | 445168.9 | 157350.04 | 282300.92 | 439757.11 | 3972558.39 |
| 2008 | 373484.35 | 241850.14 | 136694.8 | 205583.44 | 358087.86 | 176621.88 | 443795.66 | 201074.77 | -83089.72 | 74724.07 | -118037.43 | 388102.87 | 2398892.69 |
| 2007 | 127907.54 | 442564.77 | 363537.09 | 436562.83 | 335135.27 | 290418.04 | 187342.01 | 65993.82 | 318415.25 | 235257.13 | -8033.04 | 350241.83 | 3145342.54 |
| 2006 | 308651.98 | 222782.54 | 174523.86 | 333762.61 | 557037.19 | 590439.99 | 701020.45 | 571780.51 | 540271.52 | 461351.81 | 343391.63 | 266549.72 | 5071563.81 |
| 2005 | 295744.8 | 306954.96 | 312076.3 | 398063.92 | 500593.95 | 749939.48 | 646207.96 | 782441.06 | 731324.65 | 364350.53 | 420232.81 | 637368.36 | 6145298.78 |
| 2004 | 316185.43 | 502766.99 | 556373.22 | 540312.03 | 492627.83 | 400778.58 | 579276.24 | 558192.85 | 316532.61 | 608595.86 | 570128.41 | 659440.51 | 6101210.56 |
| 2003 | 0 | 0 | 0 | 0 | 13198.28 | 28468.59 | 19667.17 | 111194.44 | 387964.45 | 237369.82 | 482930.39 | 683363.12 | 1964156.26 |
Stats
Strategy
| Wins/Losses Ratio | 41.37 | Payout Ratio (Avg Win/Loss) | 0.08 | Average # of Bars in Trade | 0 |
| AHPR | 0.03 | Z-Score | -14.58 | Z-Probability | 99.9 % |
| Expectancy | 2842.59 | Deviation | $ 9734.91 | Exposure | -999999999 % |
| Stagnation in Days | 148 | Stagnation in % | 1.87 % |
Trades
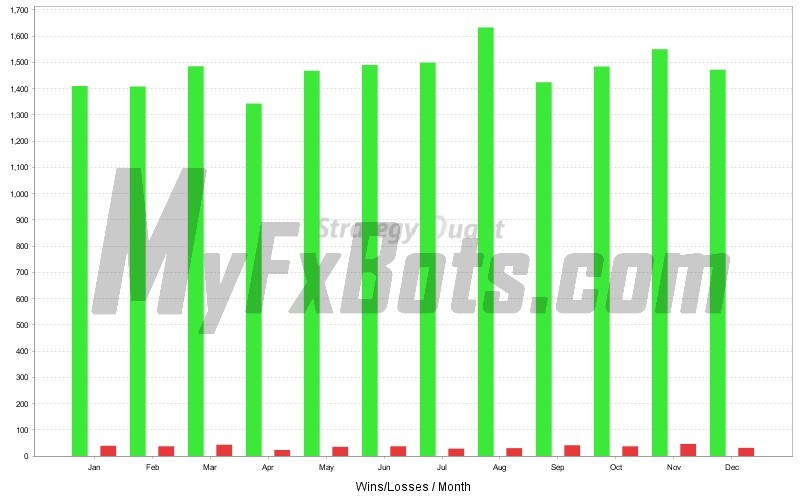
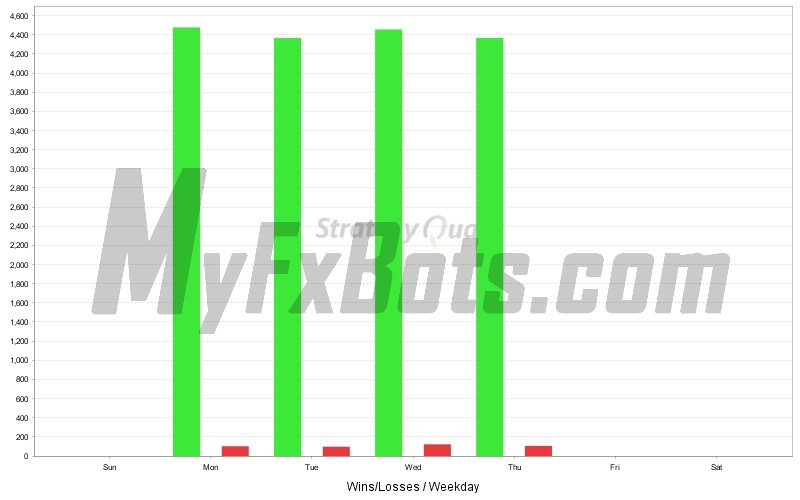
| # of Wins | 17666 | # of Losses | 427 | # of Cancelled/Expired | 0 | ||
| Gross Profit | $ 73673011.51 | Gross Loss | $ -22241940.44 | Average Win | $ 4170.33 | Average Loss | $ -52088.85 |
| Largest Win | $ 120208.6 | Largest Loss | $ -84813.32 | Max Consec Wins | 567 | Max Consec Losses | 4 |
| Avg Consec Wins | 47.36 | Avg Consec Loss | 1.15 | Avg # of Bars in Wins | 0 | Avg # of Bars in Losses | 0 |
Charts
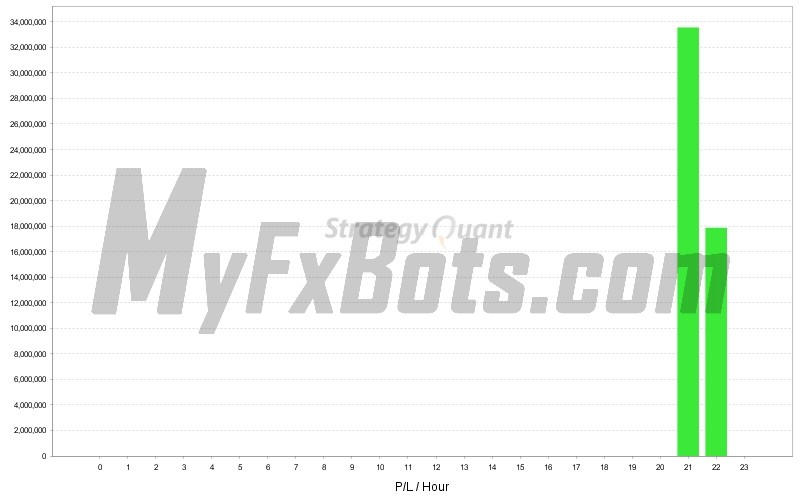
Click on the chart to see bigger image
Tags
Valery Trading
Tickmill
FXAutomater
WallStreet Forex Robot 3.0 Domination
Tick Data Suite
Algocrat AI
IC Markets
FBS
Perceptrader AI
Waka Waka
RoboForex
Forex Diamond
HF Markets
Volatility Factor Pro
XM
Traders Academy Club
InstaForex
Alpari
Forex Combo System
GPS Forex Robot
StrategyQuant X
Forex Trend Detector
GrandCapital
SMRT Algo
Broker Arbitrage
Golden Pickaxe
IronFX
AMarkets
Omega Trend
Telegram Signal Copier
FX Scalper
Quant Analyzer
FXVM
Binance
ForexSignals.com
ACY Securities
AlgoWizard
FxPro
Forex Gold Investor
RayBOT
TradingFX VPS
Commercial Network Services
Libertex
FX-Builder
Gold Scalper PRO
LeapFX Trading Academy
News Scope EA PRO
Quant Data Manager
ForexTime
Pump Trader Robot
Smart Scalper PRO
FXCharger
FX Choice
BlackBull Markets
ByBit
Vortex Trader PRO
Best Free Scalper Pro
VPS Forex Trader
Happy Forex
DARKEAS
QHoster
StarTrader
Happy Bitcoin
Forex VPS
Magnetic Exchange
MTeletool
Gold Miner
Telegram Copier
Swing Trader PRO
FX Secret Club
Forex Robot Academy
Evening Scalper PRO
Forex Robot Factory (Expert Advisor Generator)
EGPForex
Risk
Forex trading can involve the risk of loss beyond your initial deposit. It is not suitable for all investors and you should make sure you understand the risks involved, seeking independent advice if necessary.
Forex accounts typically offer various degrees of leverage and their elevated profit potential is counterbalanced by an equally high level of risk. You should never risk more than you are prepared to lose and you should carefully take into consideration your trading experience.
Past performance and simulated results are not necessarily indicative of future performance. All the content on this site represents the sole opinion of the author and does not constitute an express recommendation to purchase any of the products described in its pages.
2013 - 2025©
MyFxBots.
Cookies help us deliver our services! By using our services you agree to our use of cookies! Learn More


