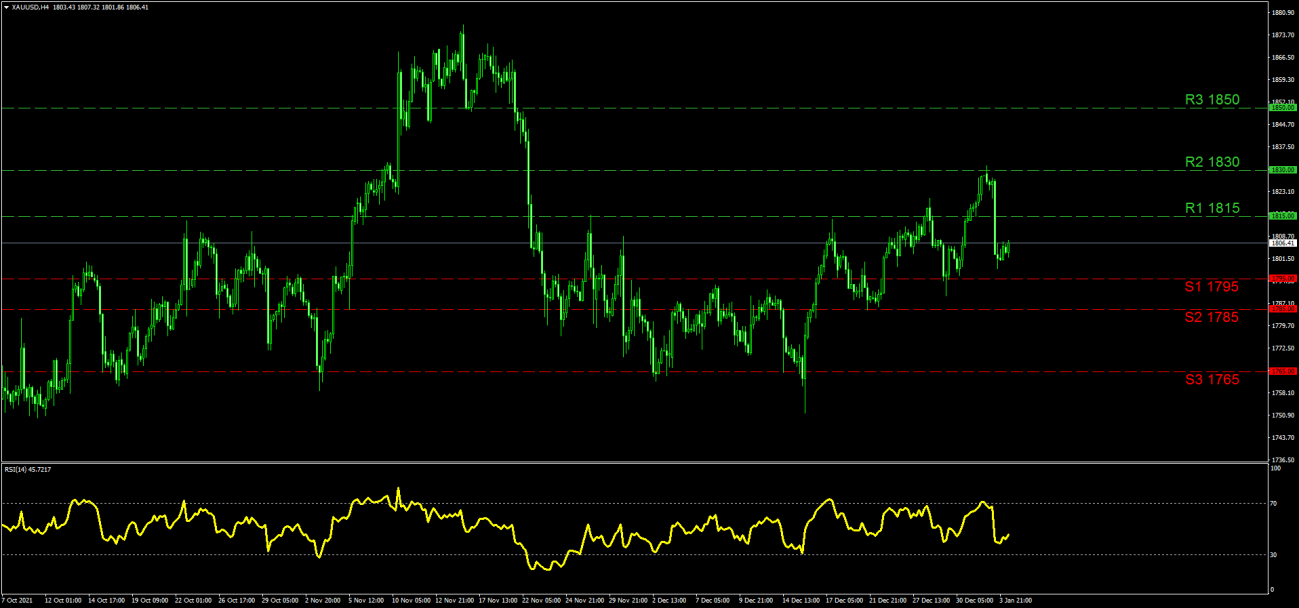
An interesting first session for the Gold market in 2022, was observed on Monday as the price action seemed to captivate traders and market participants. As the movement had not gone unnoticed this report will be aiming to bring out some important current market drivers for Gold’s price. At the same time in this report, we will attempt to provide a more medium to long-term view on the aspects that can move the Gold market.
Gold performed its largest daily selloff since late November on Monday. The movement took place during the early European afternoon as the market was crossing into the US session. This may imply that traders from around the world may have participated in this price movement. Gold lost approximately $25 during the downslide but regained some ground back and stabilized afterward. At about the same time the Dollar Index which follows the greenback’s movement as opposed to other major currencies moved in the opposite direction and gained ground.
This is a clear antagonistic movement between the USD and Gold’s price which is in play most of the time. Some analysts have argued that the movements in the US Bond yield market that was on the rise along with some positive movement in the major US stock markets had created the selloff for Gold. Others said that the market’s focus is mostly on the new variant at the moment. Some reports note that the new variant even though very transmittable may not be so severe as initially thought while this view can also lead us to believe that the health systems in various countries may not be overworked as was previously observed during the Delta variant outbreak. In this case, some economic risk may be relieved and traders may have decided to express this notion through a temporary but notable selloff in the Gold market.
Moreover, according to the Wall Street Journal factories in Europe and the U.S. are currently seeing supply-chain problems subside for the past months which may also be a source of bearish interest for Gold. Also, improved Industrial output and manufacturing activities in China and Japan seem to complement the pre-mentioned statement. Looking forward if the pandemic is to subside then some bearish sentiment can overtake Gold temporarily.
We would advise traders to keep an eye on the FED’s approach in the following months as its monetary policy which is expected to change can create serious price action in the gold market. If the FED is going to impose rate hikes as suggested broadly, then the instrument that could benefit the most under these circumstances could be the USD.
Thus from our point of view, the following months can be rather eventful and vibrant for the Gold market. In the following days, traders have a rather interesting and important economic calendar to work with. On the 5th of January, we get the FOMC meeting minutes as the Fed reviews its December 14th to 15th, 2021 policy meeting. On the 6th of January, we get the US International Trade figure for November and the weekly Initial Jobless Claims figure along with the ISM Non-Manufacturing PMI reading for December. A Key event is released on Friday the 7th with the US employment report for December is in the spotlight. Traders will be looking to comprehend the overall picture among the unemployment rate, the NFP figure, and the average earnings rate. Investors are advised to trade carefully, as this event has in the past created significant price movement across the financial markets.
Technical Analysis
XAU/USD H4
The precious metal continues to make its way higher in the most recent sessions but has not, in any case, rebounded from its selloff on Monday. The recent buying momentum is also confirmed with the RSI indicator which seems to be ascending and has reached the 45th level so far. If the buyer is extended then we might see the metal reaching the (R1) 1815 resistance level as this line was used mostly as a peak previously. Even higher we note the (R2) 1830 that was the highest level reached by the metal on Monday since late November. At the top, our (R3) 1850 line remains a long-term target to the upside and can be used in case the metal is undertaken by significant bullish interest.
In the scenario of a continuation of the recent selloff, the (S1) 1795 level can be approached first while a move below it can make way for the (S2) 1785 support to be engaged. The (S2) held its ground as a support during the pre-holiday season while in the past it was used also as a resistance making it very attractive. Our lowest level is currently noted as the (S3) 1765 line. The (R3) and the (S3) can both be used as levels for pending orders. As a conclusion in our opinion, we tend to keep a bias for a sideways motion with the price action stretching between the (R1) and the (S1). A clear break above or below these two levels could signal a trend change.


